The benefits of using Chart.js with Elementor and WordPress
Imagine you can publish live animated charts with the ease of using WordPress and Elementor as your primary web content management platform. The noteworthy benefits are:
- Create animated charts in your WordPress posts. Hands down, it will be more memorable and visually interesting than a static chart.
- Connect a live online data source to your charts and it will always serve as an up-to-date data visualization of the underlying data.
- When used in a business context, line-of-business managers can use this setup to communicate accurate and timely business data to stakeholders in a transparent and trustworthy manner.
What is Chart.js?
Chart.js is a free open-source JavaScript library for data visualization and is the second most popular JS charting library on GitHub after D3.js. It supports 8 chart types: bar, line, area, pie (doughnut), bubble, radar, polar, and scatter. Chart.js is widely considered as one of the best data visualization libraries.
How-To Steps
- Add a new Elementor page.
- On the new Elementor page, add a new Section and choose a Column layout.
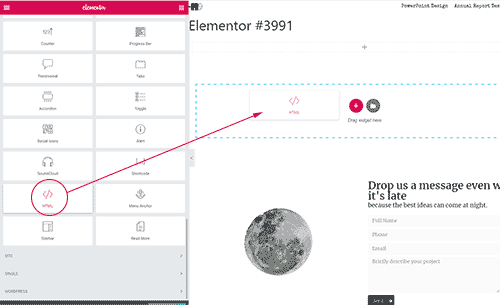
- From the Elementor widget list, drag and drop the Elementor HTML widget into the newly created column space from Step 2.
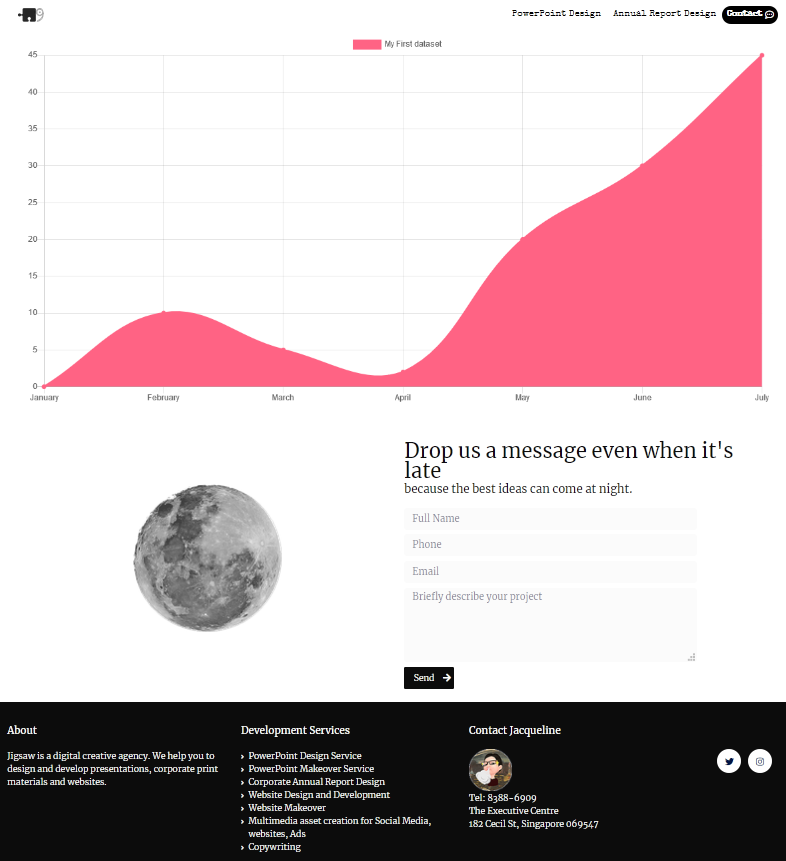
4. Lastly, simply copy and paste the following javascript code into the HTML widget content area.
<canvas id="myChart"></canvas>
<script src="https://cdn.jsdelivr.net/npm/chart.js@2.8.0"></script>
<script>
console.log("hello");
var ctx = document.getElementById('myChart').getContext('2d');
var chart = new Chart(ctx, {
    // The type of chart we want to create
    type: 'line',

    // The data for our dataset
    data: {
        labels: ['January', 'February', 'March', 'April', 'May', 'June', 'July'],
        datasets: [{
            label: 'My First dataset',
            backgroundColor: 'rgb(255, 99, 132)',
            borderColor: 'rgb(255, 99, 132)',
            data: [0, 10, 5, 2, 20, 30, 45]
        }]
    },

    // Configuration options go here
    options: {}
});
</script>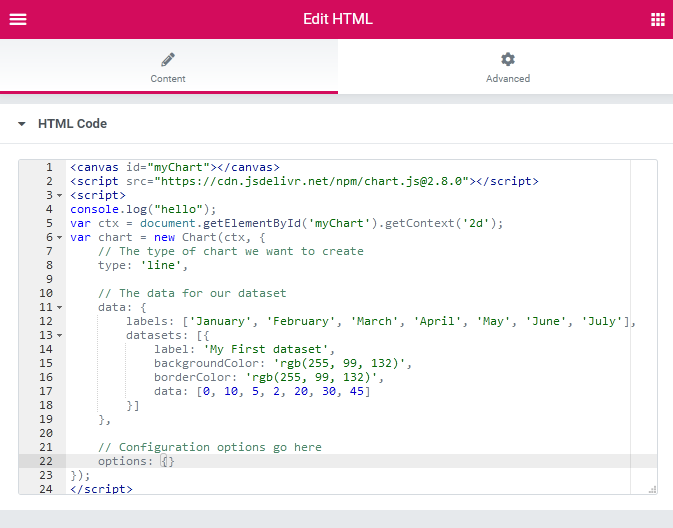
5. Save your Elementor page and Chart.js will create a chart on your WordPress website!